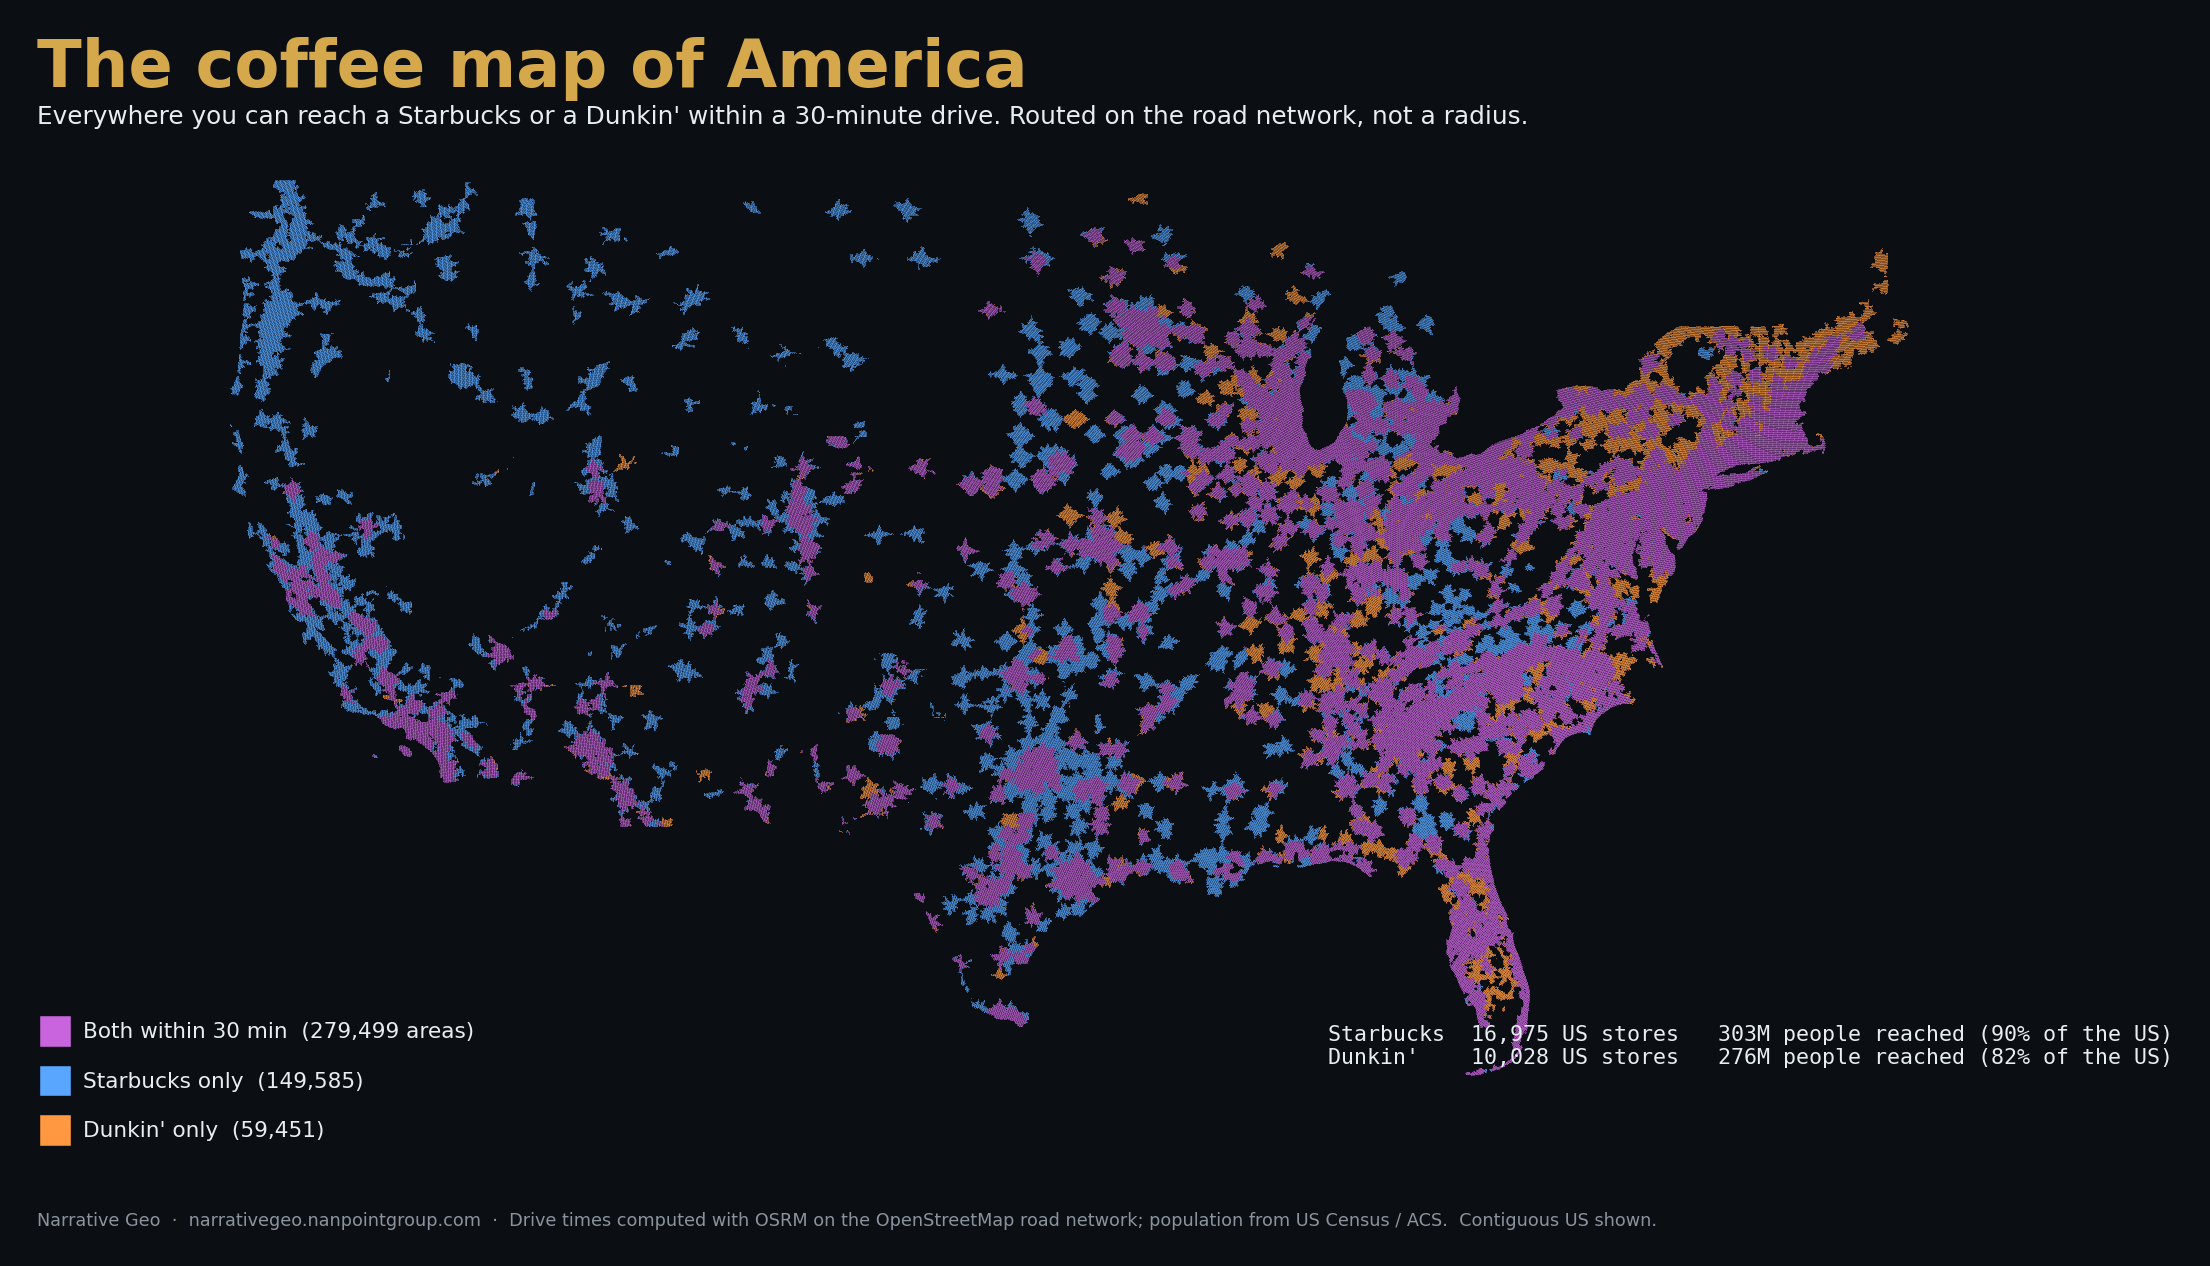
What the map shows
Every one of the 16,975 US Starbucks and 10,028 US Dunkin' locations, with a 30-minute drive-time catchment routed around each one on the real road network. Grey is where both chains reach you. Green is Starbucks only. Orange is Dunkin' only.
The numbers
| US stores | People reached | Share of US population | |
|---|---|---|---|
| Starbucks | 16,975 | 302,889,374 | 90.4% |
| Dunkin' | 10,028 | 275,607,373 | 82.3% |
Both chains reach 279,499 of the hexagons on this map. 149,585 are Starbucks only and just 59,451 are Dunkin' only.
Store counts come from each chain's own store locator, pulled 2026-08-30. An earlier version of this map used a third-party POI list that carried 11,026 Dunkin' locations, including a handful that do not exist — most visibly two phantom stores in Washington and Oregon. Dunkin's locator lists no stores in either state, and this version reflects that.
The regional split is the story
Starbucks reaches more of the country, but that undersells how differently the two footprints are shaped. Dunkin's exclusive territory is almost entirely New England and the Northeast corridor. Across the Mountain West and the Plains, Starbucks is frequently the only one of the two within half an hour.
That is a coverage difference, not a preference one. It says where each chain chose to build, and it shows how much of Dunkin's addressable population sits inside territory Starbucks already serves.
Method
- Store locations from a maintained US POI set, both chains, all US locations.
- Drive times computed with OSRM on the OpenStreetMap road network. No radii.
- Catchments aggregated to H3 resolution-7 hexagons, then unioned per chain.
- Population from the US Census / American Community Survey at block-group level.
- Rendered in Python with matplotlib. Contiguous US shown; Alaska and Hawaii omitted for legibility.
Why routed rather than a radius
A three-mile ring assumes people travel equally in every direction at a constant speed. Rivers, freeways without crossings, mountains and one-way systems all say otherwise. Routing produces irregular catchments that stretch along arterials and stop dead at barriers, which is what a real trade area looks like.
Narrative Geo does not sample. Every trade area is routed on the actual road network with OSRM, against full Census/ACS population and a maintained POI set. The drive-time matrix is precomputed at 1.08 billion rows, so a national query across a 20,000-store chain returns in seconds rather than being metered per location.