Five Below reported on September 2. Net sales and comparable sales were both up, the company raised its full-year sales outlook, and analysts lifted price targets across the board, per the release and the coverage that followed. Reports put the shares up about 6%. The company said it opened 52 net new stores in the quarter and crossed into Idaho in August, its 47th state. Management again pointed to a long-term US store opportunity well above the current base.
The Idaho line is the one worth sitting with. This is a chain that has been opening stores for a long time, and it reached its 47th state last month. That is not a gap in the map. It is the shape of the runway.
What the built base actually holds
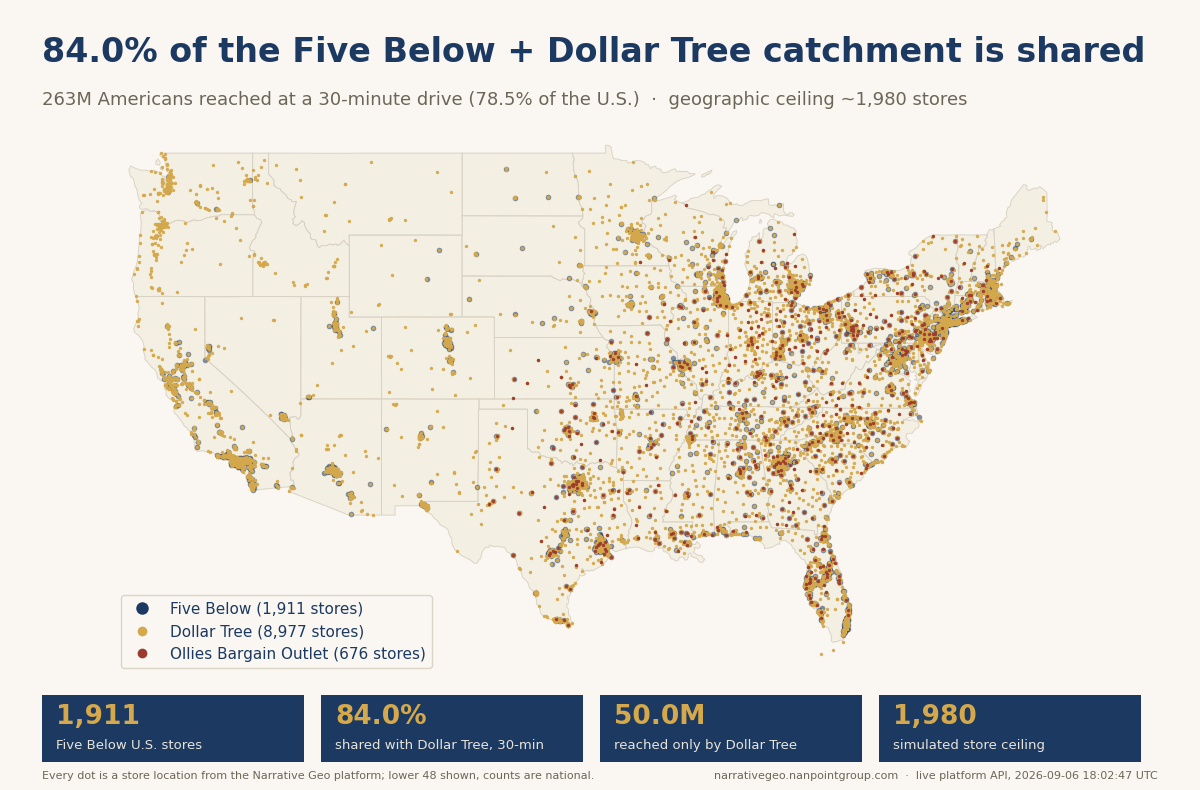
We map every location to a 30-minute drive-time trade area at H3 resolution 7 and count the people inside. Five Below: 1,911 stores, reaching 78.48% of the US population, or 137,585 people per store.
The average buries the story. The median store's trade area holds 723,168 people. The tenth-percentile store holds 98,366. The ninetieth holds 2,350,998, and the largest sits inside 10,206,251. So this is really two chains stapled together. A metro business with very large catchments, and a long tail of small-market stores.
That matters because new units get built at the tail, not at the median. When a company guides to a much larger store base, the marginal store it is describing looks like the tenth percentile, not the fleet average. Strong comps at the existing base tell you very little about that.
Where the next stores go
Our saturation model puts the practical ceiling near 1,980 stores at current density. That is 96.5% built. Out of a candidate pool of 196 sites, 69 clear as incremental, and 65 sit below the 30% cannibalisation threshold we use as a cut.
The whitespace screen returns 60 candidates holding 1,605,427 people between them. The top-scoring market, at 0.787, is Port Orchard, Washington, with 21,843 people and average household income of $90,917. Bremerton and Lacey show up on the same list. So does Fort Wayne, Indiana. So does Caldwell, in the Boise metro. Three of the top eight are Indianapolis suburbs: Avon, Greenwood and Brownsburg.
That is what runway looks like from the ground. Not open territory. Pockets of roughly twenty thousand people each, in places where the model says a store would not eat the store next door. The demographics support it. Average household income across the covered base is $96,854, and the covered population skews to working age.
Dollar Tree is the floor, Ollie's is the wedge
Dollar Tree runs 8,977 stores and covers 93.35% of the US. 83.96% of the population Five Below reaches is also within 30 minutes of a Dollar Tree. Tighten the radius to five minutes and 81.2% of the people Five Below reaches are still inside a Dollar Tree catchment, against 25.4% the other way. Five Below's network is 0.21 the size of Dollar Tree's by store count, and it sits almost entirely inside it. Every whitespace market on our list is a market Dollar Tree has already priced.
Ollie's is a different relationship. 676 stores, 45.88% of the US, and 51.08% overlap with Five Below at 30 minutes. Pull in to 15 minutes and the overlap falls to 30.8%. There are 122,068,771 people Five Below reaches that Ollie's does not. The two chains are chasing the same value customer through different geography, which is the more interesting version of the competitive question.
None of this argues with the quarter. It sets a test for the next several. If store growth keeps landing in thin trade areas, average unit volumes drift down even while the company hits its opening count. That is a footprint question before it is a merchandising one, and it is measurable now rather than in hindsight.
The exhibit pack behind these numbers, including the trade-area maps, the density distribution, the saturation table and the overlap work, is available if you want it.