Walmart shares fell about 9% on Thursday, August 20. Reporting put it as the worst single-day drop in more than four years, with more than $80 billion of market value gone. The trigger was not the top line. Revenue was reported up 5.9% to $187.9 billion, adjusted EPS at $0.81, and the company raised full-year guidance. The problem was the US comp: 2.6% ex-fuel against a Wall Street number closer to 3.5%, described as the slowest pace in more than six years. Transactions were reported up 1.5% and ticket up 1.1%.
A 2.6% comp with positive transactions is not a collapse. It is a share question. Numerator data cited in the trade press has Costco, Amazon and Walmart all gaining US grocery share over the past year while the large supermarket companies lost it. If Walmart is still taking share and still growing trips, then the useful question is which stores are doing that work and which ones sit in the most contested ground.
That is a geography question, and geography we can measure.
The footprint
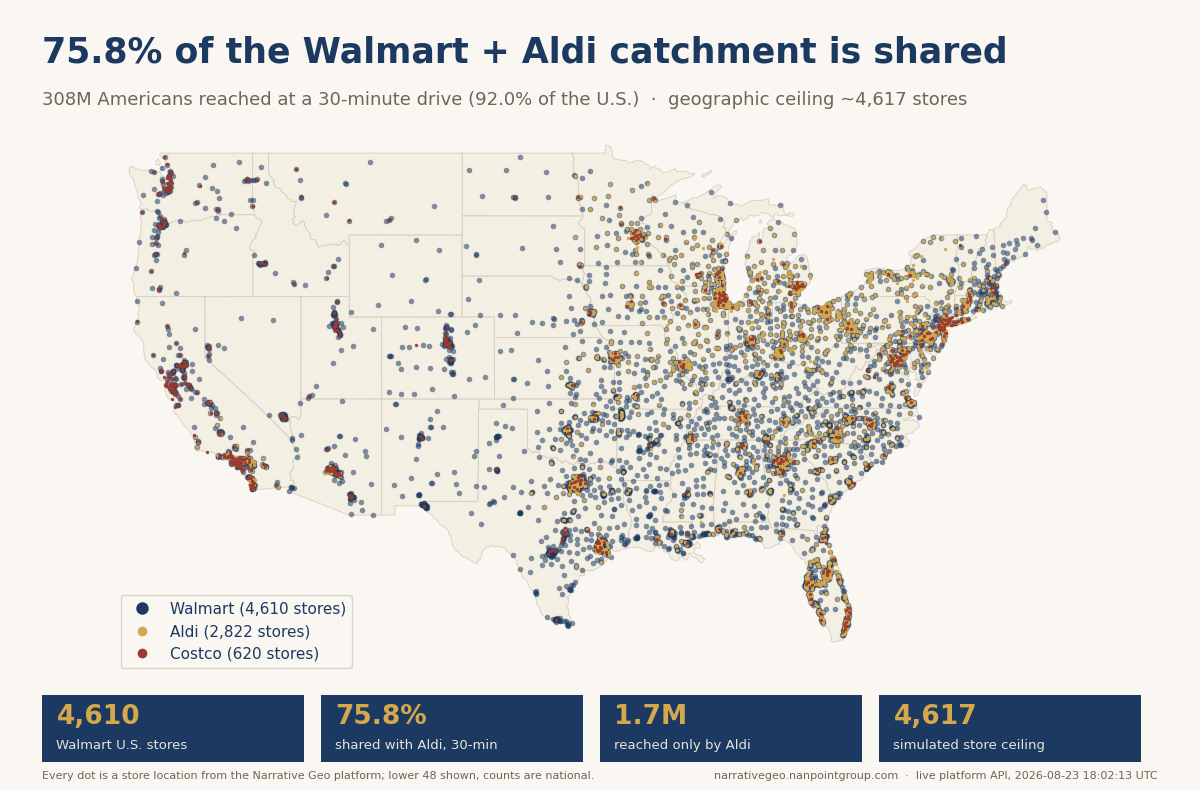
We map 4,610 Walmart stores and draw a 30-minute drive-time trade area around each one. Stacked together, that footprint covers 91.96% of the US population. Average household income inside it is $93,488. The median store has 293,574 people inside its ring, and 2,119 stores have fewer than 250,000. Across the chain it works out to 66,834 people per store.
Those facts sit awkwardly together. Near-total national coverage plus a long tail of thin stores means the marginal Walmart is not opening into an empty market. Our saturation model puts the practical US ceiling at 4,617 stores against 4,610 open. That is 99.8% of the ceiling, with 7 incremental sites left before the returns break down. The whitespace screen returns 10 candidate markets, and all 10 together hold 635,704 people. The best-scoring one is Capitola, California, at 53,272 people and $120,174 average income.
For a chain this size, that is a rounding error of new demand. Comp growth has to come out of the boxes that already exist.
Where the boxes are contested
Now lay the competition on top.
At 30 minutes, 75.78% of the population Walmart reaches also sits inside an Aldi trade area. For Costco the figure is 68.22%. Read at that radius, the two look like the same overlap problem.
They are not. Tighten the drive time and they split apart. At 10 minutes, Aldi shares 60.6% of Walmart's reach and Costco shares 29.5%. At 5 minutes, Aldi is at 33.5% and Costco at 8.1%.
That gap is the story. Aldi gets there with 2,822 stores against Walmart's 4,610, a ratio of 1.63 Walmart stores per Aldi. Costco gets there with 620, a ratio of 7.44. Aldi is close-in and dense, sitting on the everyday grocery trip. Costco is a destination that pulls from a long way out and shows up in the wide rings only.
So the two chains take different things. Nobody drives past an Aldi to buy the same milk somewhere else. People do plan a Costco run and stock up for a month. In a quarter where transactions were reported growing faster than ticket, the pressure looks more like the close-in trip than the stock-up one. And 33.5% of Walmart's reach lives five minutes from an Aldi.
What to hold into November 20
Walmart prints again on November 20. A map does not forecast a comp. What it does is tell you which version of a soft comp to believe.
If basket is the weak leg, the 2,119 stores with thin trade areas and heavy close-in Aldi proximity are where to look first. If trips are the weak leg, note that the box count is effectively capped at 99.8% of the modelled ceiling, so anything that improves from here has to improve inside rings that are already drawn. The whitespace list is real but small: 10 markets, 635,704 people, top of the list in Capitola.
The exhibit pack behind this piece, the trade-area maps and the Aldi and Costco overlap tables, is available ahead of the print to anyone who wants it.